PARCB Time Course Multiomics Explorer
2D PCA and Boxplots
Click here to visualize gene expression of our PARCB time course samples on a 2D principal component analysis (PCA). Here, users can also visualize PARCB time course transcriptomic data by their real timepoint labels or by their determined hierarchical cluster (HC).
3D PCA Plot
Click here to visualize gene expression of our PARCB time course samples on a 3D PCA. Outputted figures are rotatable for better perception of arc-like and bifurication trajectories identified in our paper.
Manuscript Figures
Click here to visualize 3-D presentation of Figure S7, S8, and S9 in the manuscript.
Single-Cell UMAP
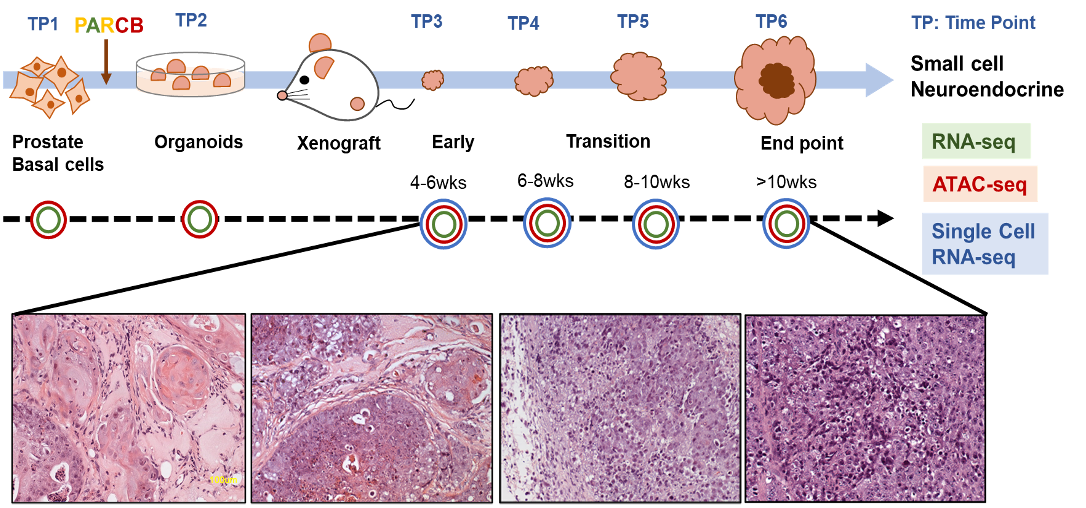
Click here to visualize gene expression of our PARCB time course single-cell data. Here, single-cells from four time-defined serial tumor sets: P2, P5, P7 and P8 (TP3-TP6) underwent uniform manifold approximation and projection (UMAP).