NEWS:
To obtain an executable version of RRHO, please contact the RRHO development.
An R package version of RRHO has been developed and is available via Bioconductor.
A <batch submit RRHO interface> is now available.
Manuscript
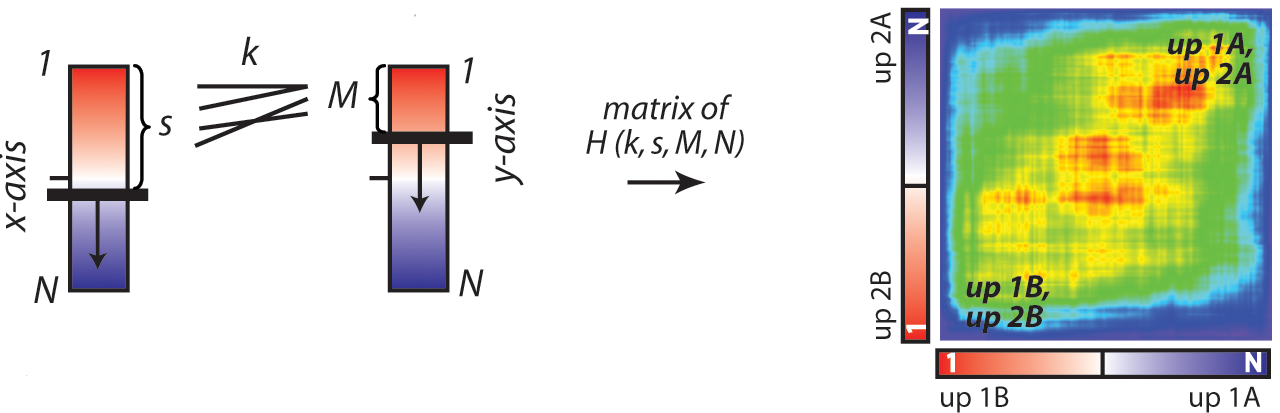
The RRHO algorithm allows for the comparison of two gene expression signatures. Each signature is processed as a ranked list based on expression differences between two classes of samples. The signatures can be input either as raw expression data and sample and class labels, or as a preranked gene list.
Getting Started
The simple version of Rank Rank Hypergeometric Overlap (RRHO) only requires a tab-delimited text file with the following columns:
The descriptions for your datasets and their classes are optional but recommended to keep track of your analysis. Default values will be assigned each of the fields if nothing is specified.
Rank rank options
The step size is used to bin the ranked items to improve the run time of calculating the hypergeometric distribution. An optimal step size is small enough to match the image resolution to the overlap patterns in the data, but large enough to reduce computational time. For gene expression data on the scale of 10,000-50,000 probes, we recommend a step size of 100-500.
Reverse rank lists will reverse the ranks of the items in one or both of the datasets.
In addition to the hypergeometric heat map, you may select two additional graphs:
Benjamini-Yekutieli multiple hypothesis correction can be applied.
The output can include a list(s) of the overlapping genes within the region(s) of maximal statistical overlap.
The following parameters are used as an example analysis of Rank Rank Hypergeometric Overlap (RRHO). Feel free to download the sample file and try it yourself.
Show sample files and parameters [+]